
Old Oakville, Morrison, and Ford in Q1 2026: What the Numbers Actually Tell Us
Petrus Engelbrecht & Joshua Engelbrecht April 23, 2026
Petrus Engelbrecht & Joshua Engelbrecht April 23, 2026
OLD OAKVILLE · MORRISON · FORD | MARKET REPORT | Q1 2026
Old Oakville, Morrison, and Ford in Q1 2026: What the Numbers Actually Tell Us
By Engelbrecht Associates | Sotheby’s International Realty Canada
Published April 2026
Here is the quiet story of the first quarter: in Old Oakville, Morrison, and Ford, competitive intensity did not fall through the winter. It climbed, every single month. By March, homes were selling above asking in numbers we have not seen since the last tight spring. The regional headlines are telling you one thing. The three neighbourhoods are telling you another. Pay attention to the second story.
Most of what you are reading about the Oakville market right now is wrong for these three neighbourhoods. Not maliciously wrong. Just wrong at the wrong level of resolution. Regional averages pull in apartments in Milton, townhouses in north Oakville, and a geography that stretches from the escarpment to the lake. When those segments soften, the regional number drops — and everyone writes the same story about a cooling market.
That story is not the story of Old Oakville, Morrison, and Ford (collectively Eastlake). After decades of experience in these streets, we have rarely seen the gap between the regional narrative and the local reality this wide. So let us show you what actually happened.
The Thing Nobody Is Telling You About Q1
In January, not a single detached home in the three neighbourhoods sold above its asking price. Zero. Buyers had leverage and they used it.
In February, eight per cent did.
In March, fifteen per cent did.
Competitive intensity roughly doubled, then doubled again. The share of homes selling above asking went from zero to eight to fifteen per cent across three months. That is not a cooling market. That is a market quietly re-tightening — while the regional headlines say the opposite.
What changed? Not the Bank of Canada. The policy rate held steady at 2.25 per cent through the quarter, and the market has priced in a hold for April. Not a flood of buyers. Transaction volume in the three neighbourhoods was roughly in line with last March. What changed was the supply side. Listings came on, but fewer of them — new-listing volume in March was down more than a quarter year over year. And active listings at month-end were lower than a year ago. The buyers who had been looking since January started deciding. The supply available to them was tighter than the regional picture suggested. And the result was competitive pressure.
This is the kind of turn you can miss entirely if you are reading the market through its aggregate. Which most people are.
What Actually Happened, Month by Month
January was the soft one. Ford saw new-listing volume more than triple from December. Old Oakville recorded a single detached sale and nine sellers who pulled their listings rather than accept the market. Every detached sale in Ford that month closed below its asking price. If you had looked at January and stopped looking, you would have written the exact story the regional headlines are still telling.
February was the pivot. Months of inventory — the measure of how long it would take to clear current listings at the current sales pace — tightened from 8.4 a year earlier to 6.5. New listings came in 35 per cent lower than a year before. Buyers who had been circling since Christmas started transacting.
March was the confirmation. Fifteen per cent of detached sales cleared above asking. More than sixty per cent of homes listed that month were still on the market at month-end, not because they were being rejected but because the spring buyer pool had not finished working through them. The median detached sale price in the three neighbourhoods was meaningfully higher than the same month a year ago.
Three months. One direction. The trajectory is the story.
A Different Way to Look at the Supply Side
Price is the number people watch. It is not always the most revealing one.
Here is a cleaner way to understand what the first quarter did. Picture every detached home that was either already listed or came newly onto the market in Old Oakville, Morrison, and Ford between December and the end of March. It is a pool of about 188 homes. Some sold. Some were quietly pulled off the market by their sellers. Some had their listing agreements expire. A few were paused.
Now look at where they went.
Thirty-four sold. Fifty-nine did not. Of those fifty-nine, forty-one were terminated outright by their sellers, fifteen expired, and three were suspended. The rest are still active, waiting.
For every one home that transacted in the three neighbourhoods across those four months, nearly two left the market without selling. That is the most important seller statistic of the quarter — and it is not a price.
What this means in practice is that a sizable share of the sellers who entered winter with last year’s expectations have already walked away. Quietly. Without transacting. They will return — repriced, re-photographed, often with a different strategy — but the lesson of the quarter for anyone thinking about listing is unmistakable. Pricing to an outdated benchmark in this market does not produce a discount. It produces a withdrawal.
The Regional Story Is a Different Story
The Oakville, Milton and District board reported March benchmark prices down roughly eleven per cent year over year. That is a real number for the regional composite. It is not a meaningful number for a detached home on a mature lot in Morrison or Old Oakville.
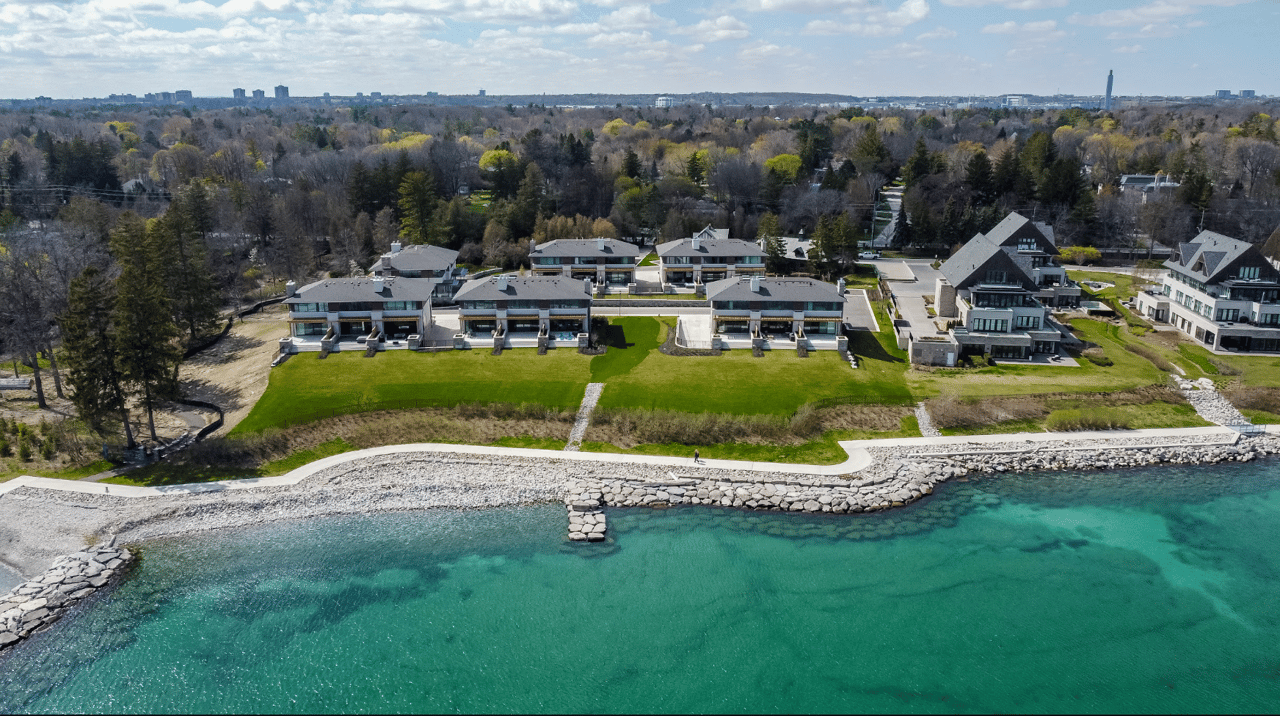
Old Oakville, Morrison, and Ford are driven by a different buyer. Families relocating from the Greater Toronto Area seeking schools, lot depth, and proximity to the lake. Executives relocating from elsewhere in Canada who want the fabric of Old Oakville. A meaningful, though smaller, cohort from abroad — drawn by Canadian stability, the private-school ecosystem, and a residential character that genuinely has no international equivalent within an hour of a major financial centre.
These buyers are not comparing their Morrison shortlist to a one-bedroom in Burlington. They are evaluating whether the specific home they want is available and whether the number on it is fair. The Q1 2026 data says that through the quarter, more and more of them concluded the answer was yes — and moved.
Rates Are Not the Story Anymore
For three years, every buyer conversation in these neighbourhoods started with borrowing costs. That era ended sometime in the last two quarters, and Q1 2026 is the confirmation. The Bank of Canada held the policy rate at 2.25 per cent in March for the third consecutive decision. Most major Canadian economists now expect a hold through the balance of the year.
Rates are no longer the driver of this market — confidence is. And confidence returned to the three neighbourhoods, in the data, across the three months of the quarter.
What This Means if You Are Buying
Two things are simultaneously true, and the sophisticated buyer is holding them at once.
The typical transaction in Q1 still cleared below the asking price. Median sale-to-list ratio for the quarter was 95 per cent. Negotiation is genuinely available — on the right property, at the right moment, in the right conversation.
At the same time, by March, fifteen per cent of detached sales were going above asking, and that share had climbed every single month of the quarter. Negotiation is available on average. It is not available on the best homes, on the best streets, in the tightest tiers. The buyers who are winning right now are the ones who have already done the neighbourhood work — who know the block they want, who can tell a strong listing from a struggling one, and who can move within a week rather than a quarter when the right home appears.
The opportunity in today’s market is that rates have already done their work. The buyers who understand that are transacting. The buyers still waiting for a rate cut are watching the ones who did not.
What This Means if You Are Selling
The single number a seller in Old Oakville, Morrison, or Ford should carry into their next conversation is not a price. It is the ratio we opened this section with: across the quarter, for every home that sold, nearly two were pulled without selling.
The homes that transacted in Q1 2026 were, in a meaningful majority of cases, priced to the evidence of what comparable properties had actually sold for — not to what similar homes had listed for a year ago. They were prepared to contemporary standards. And they were presented by teams that understood how this quarter’s buyer was reading the market.
The homes that did not transact were not doing anything mysteriously wrong. In most cases, they were priced to a market that no longer exists.
This is no longer a momentum-driven market. It is a precision-driven one. In Old Oakville, Morrison, and Ford, the sellers who priced to the Q1 data transacted. The sellers who priced to an earlier peak withdrew. There is no third category in this quarter’s numbers.
The Quarter at a Glance
|
OLD OAKVILLE, MORRISON & FORD · DETACHED, Q1 2026 |
|
|
Detached sales across the three neighbourhoods |
34 |
|
Median days on market |
33 |
|
Median sale-to-list ratio |
95% |
|
Share of sales above asking — January |
0% |
|
Share of sales above asking — February |
8% |
|
Share of sales above asking — March |
15% |
|
Homes that sold vs. homes pulled without selling |
34 : 59 |
|
Bank of Canada policy rate (held, March 18, 2026) |
2.25% |
The Takeaway
The story of Q1 2026 in Old Oakville, Morrison, and Ford is not the story the regional headlines are telling. Competitive intensity rose every month. Inventory tightened year over year. Sellers who priced to reality transacted. Sellers who priced to memory withdrew. And the buyers who moved first took the better homes.
Where this is heading is a spring market that will separate cleanly into two groups. The buyers and sellers who act on what actually happened in the three neighbourhoods — not on what the aggregate said — will transact on terms they will be satisfied with in five years. The rest will wait for a signal that does not arrive on the timeline they expect, and will re-enter the market later with less leverage than they have right now.
This is the window. It will not remain open indefinitely. Not because prices are about to spike. Because choice is already narrowing, and the buyers who are quietly transacting now are taking the better homes first.
Sources: Detached-market figures for Old Oakville, Morrison, and Ford sourced from The Habistat analytics platform, in partnership with PropTx, Q1 2026 reporting. Regional context: Oakville, Milton and District Real Estate Board and CREA MLS® statistics, March 2026 release. Rate environment: Bank of Canada policy rate announcement, March 18, 2026. National context: Canada Mortgage and Housing Corporation 2026 Housing Market Outlook.
Data reflects market conditions as of the publication date (April 2026). Neighbourhood-level statistics in small, high-value segments can vary month to month; figures should be reviewed against current reporting before any transaction decision.
Engelbrecht Associates | Sotheby’s International Realty Canada | engelbrechtassociates.com | Oakville, Ontario
Stay up to date on the latest real estate trends.

Southeast Oakville
A local perspective on who's buying, where demand is strongest, and what early summer buyer activity reveals across Old Oakville, Morrison, and Ford.
Luxury Real Estate
Discover what buyers need to know before building a custom home in Morrison and Ford, from lot selection and zoning to builder selection, timelines, and maximizing lon… Read more

Buying & Selling
Discover how school catchment boundaries influence home values, buying decisions, and access to top-rated schools in Old Oakville, Morrison, and Ford.
Buying & Selling
Southeast Oakville Spring 2026 Market Recap | Real Estate Statistics & Trends

Buying & Selling
Discover how decades of specialized experience in Old Oakville, Morrison, and Ford give Engelbrecht Associates the local knowledge, pricing precision, and strategic ad… Read more
Buying & Selling
Understanding the Three Buyer Groups Driving Demand in Old Oakville, Morrison, and Ford—and How Sellers Can Position Their Homes to Attract Them

Buying & Selling
How Engelbrecht Associates Combines Global Sotheby's Reach with Deep Local Expertise in Old Oakville, Morrison, and Ford

Buying & Selling
A neighbourhood-by-neighbourhood look at Old Oakville, Morrison, and Ford reveals where buyers are acting, where listings are stalling, and what the data suggests for … Read more

South East Oakville
A step-by-step guide to pricing, preparing, marketing, and successfully selling a luxury home in Old Oakville, Morrison, and Ford.
With our extensive network, we can assist regardless of where your property journey takes you. It’s about knowing who you are, what you love, and how to make your property journey one that will leave a lasting memory. It’s as simple as that. Contact us today!